


Meteorologists like to categorize and rank things, and snowstorms are no exception. That’s where the Regional Snowfall Index comes in.
NOAA’s National Centers for Environmental Information started officially using the Northeast Snowfall Impact Scale (NESIS) in 2005. NESIS ranks snowstorms not just on weather, but on societal impacts.
It uses population and historical snowfall information from the eastern two-thirds of the U.S. and applies that to Northeast snowstorms. Big snows falling on big cities have big impacts, so NESIS accounts for that by incorporating how much snow fell over an area and the population affected.
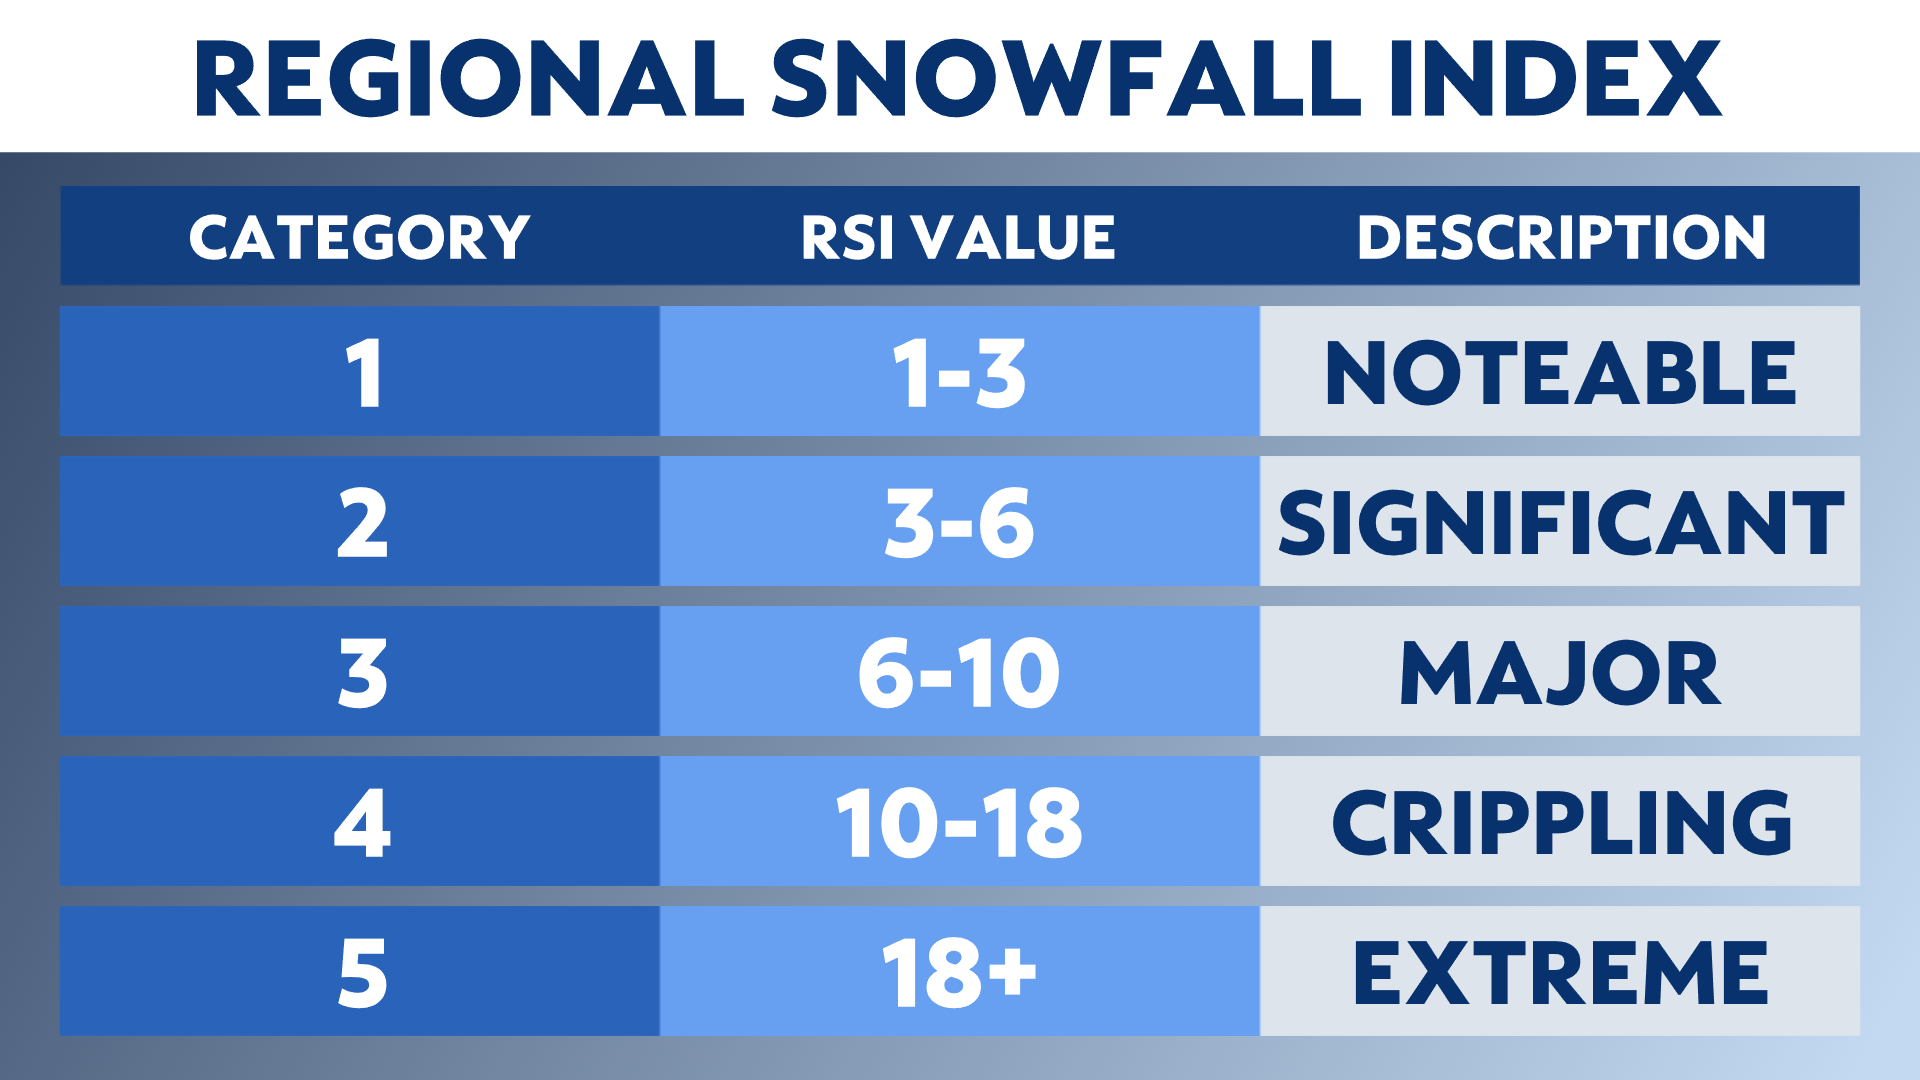
All that data leads to a score, which corresponds to a 1-5 scale.
However, the calculation doesn’t work well in other areas. For example, a snowstorm in North Carolina that’s significant by Southern standards might not even rank using the NESIS formula.
That’s where the Regional Snowfall Index comes in. The RSI ranks storms based on the historical particulars of smaller regions. Like the NESIS, it gives storms a 1-5 rating based on population and snowfall.
Like the Enhanced Fujita tornado damage scale, NESIS and RSI rate snowstorms after they’ve happened.
Wondering what the RSI says the top three snowstorms are in the Northeast?
#1: Feb. 22-28, 1969
RSI: 34.026, Category 5
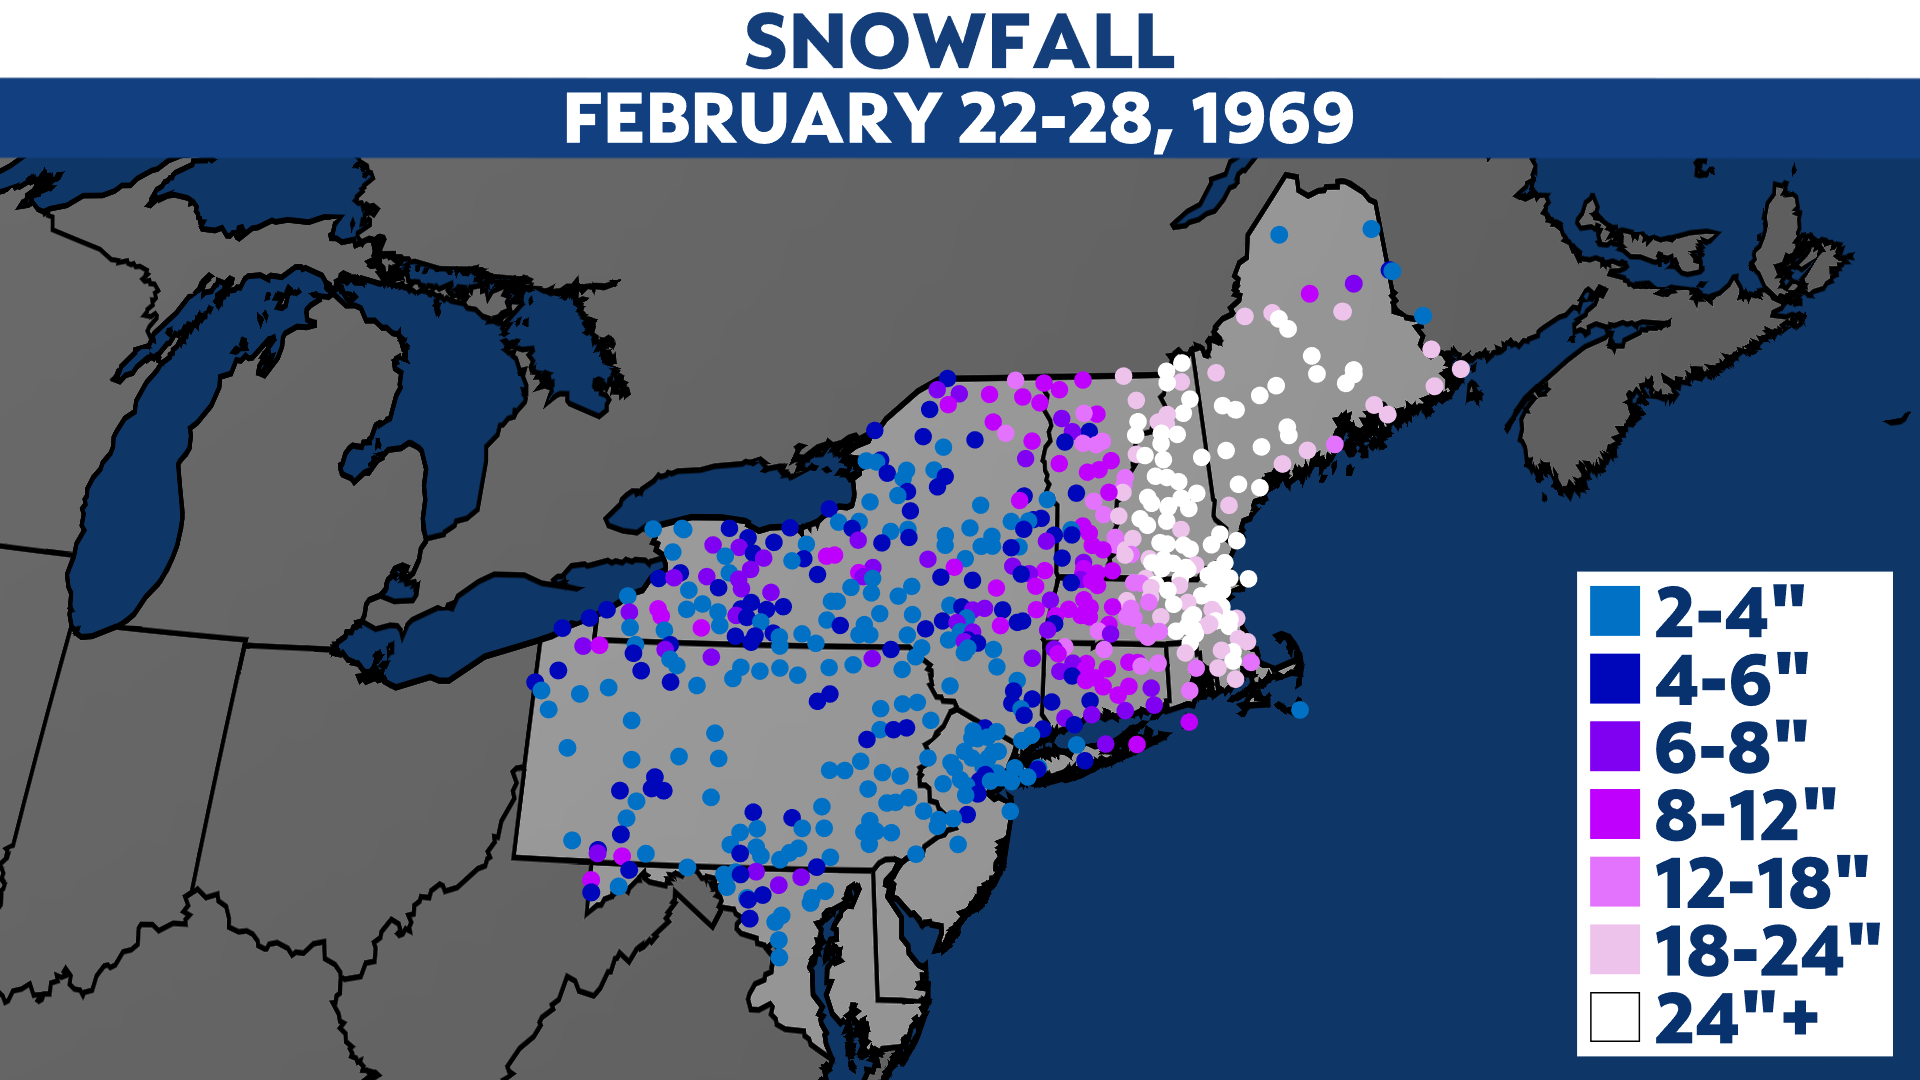
This winter storm had its sights set on New England. The majority of that region got at least two feet of snow, including Boston.
#2: Mar. 12-15, 1993
RSI: 22.117, Category 5
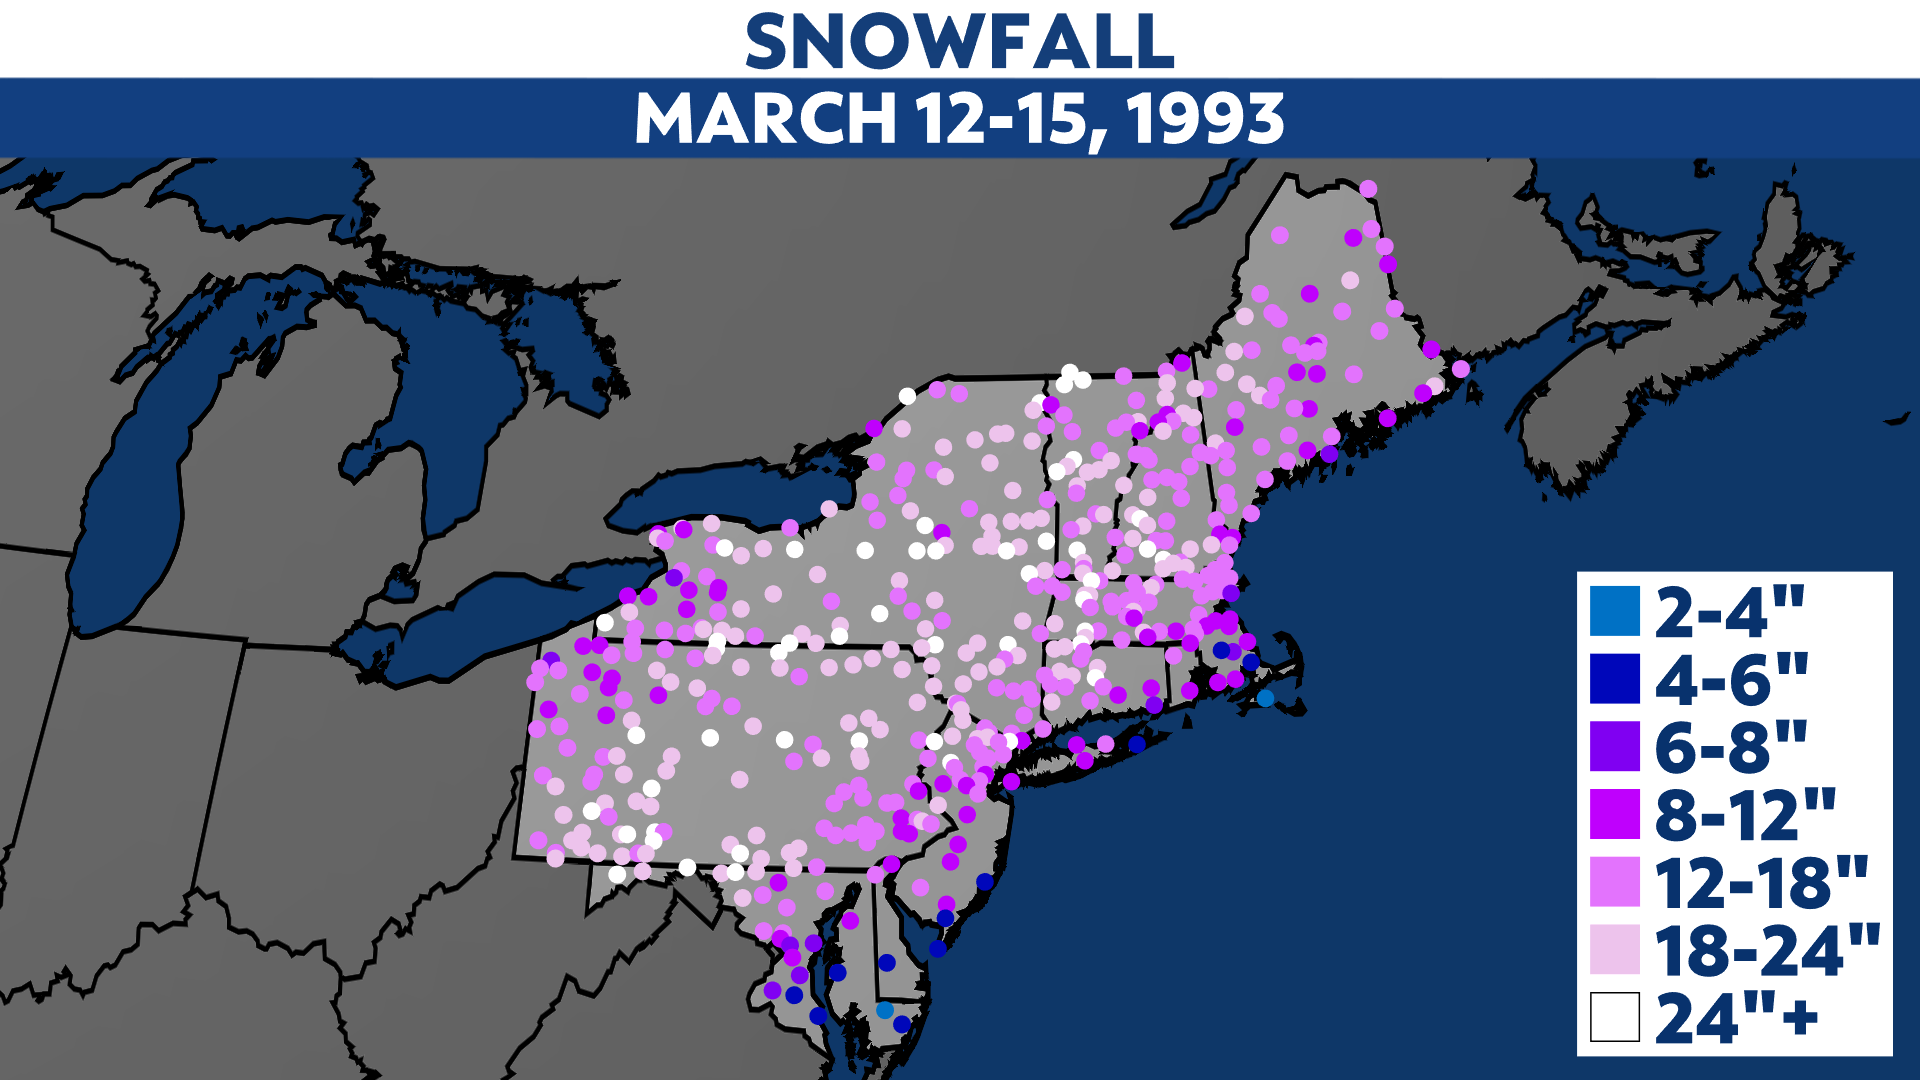
The Blizzard of 1993 was one of the most powerful nor'easters on record, clobbering a huge area with heavy snow. Nearly the entire state of New York got more than a foot and some places topped three feet.
#3: Jan. 6-9, 1996
RSI: 21.708, Category 5
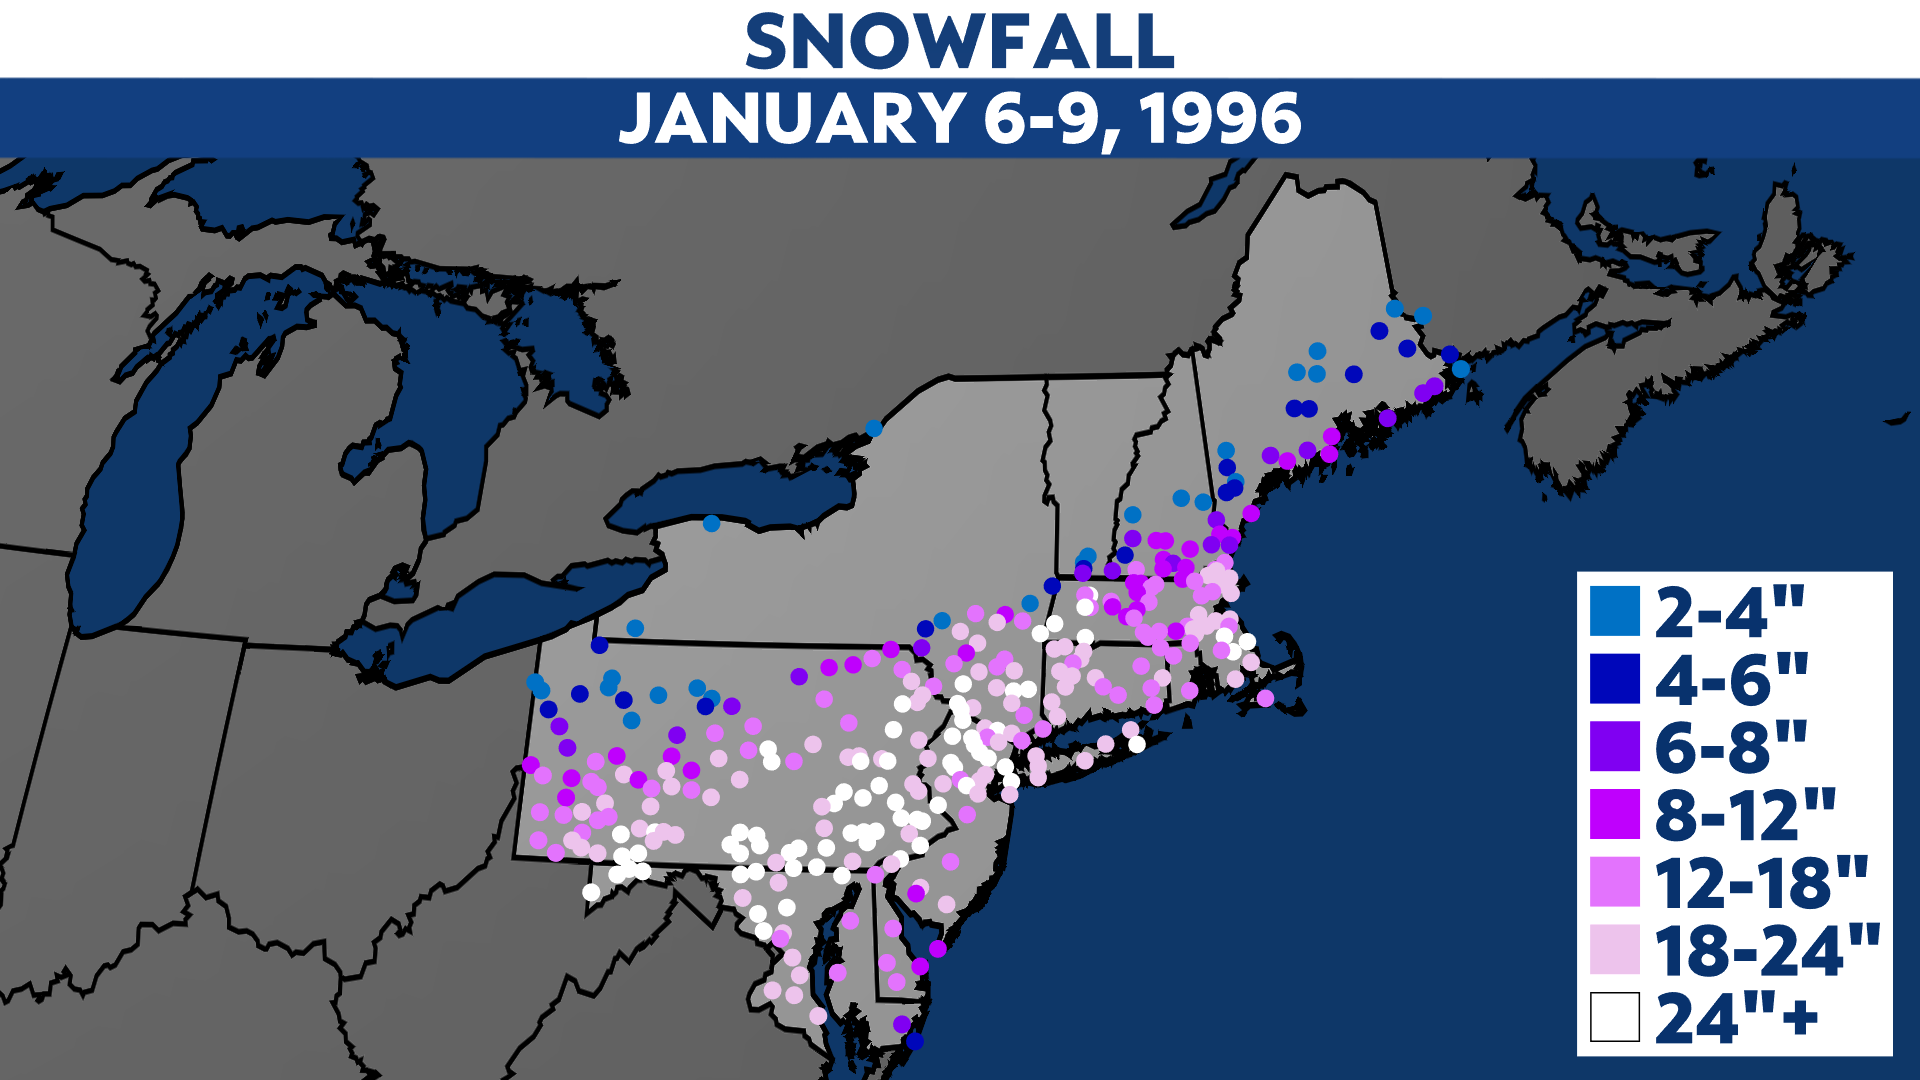
The Blizzard of 1996 dumped more than 20 inches of snow on New York City.