


Eric Sanderson spent the night as remnants of Hurricane Ida arrived over New York City in the same, sorry way as so many others.
He waded through the flooded basement of his home on City Island in the Bronx to pick out soggy belongings. He contemplated the pool of water where his backyard used to be. He thought existential thoughts.
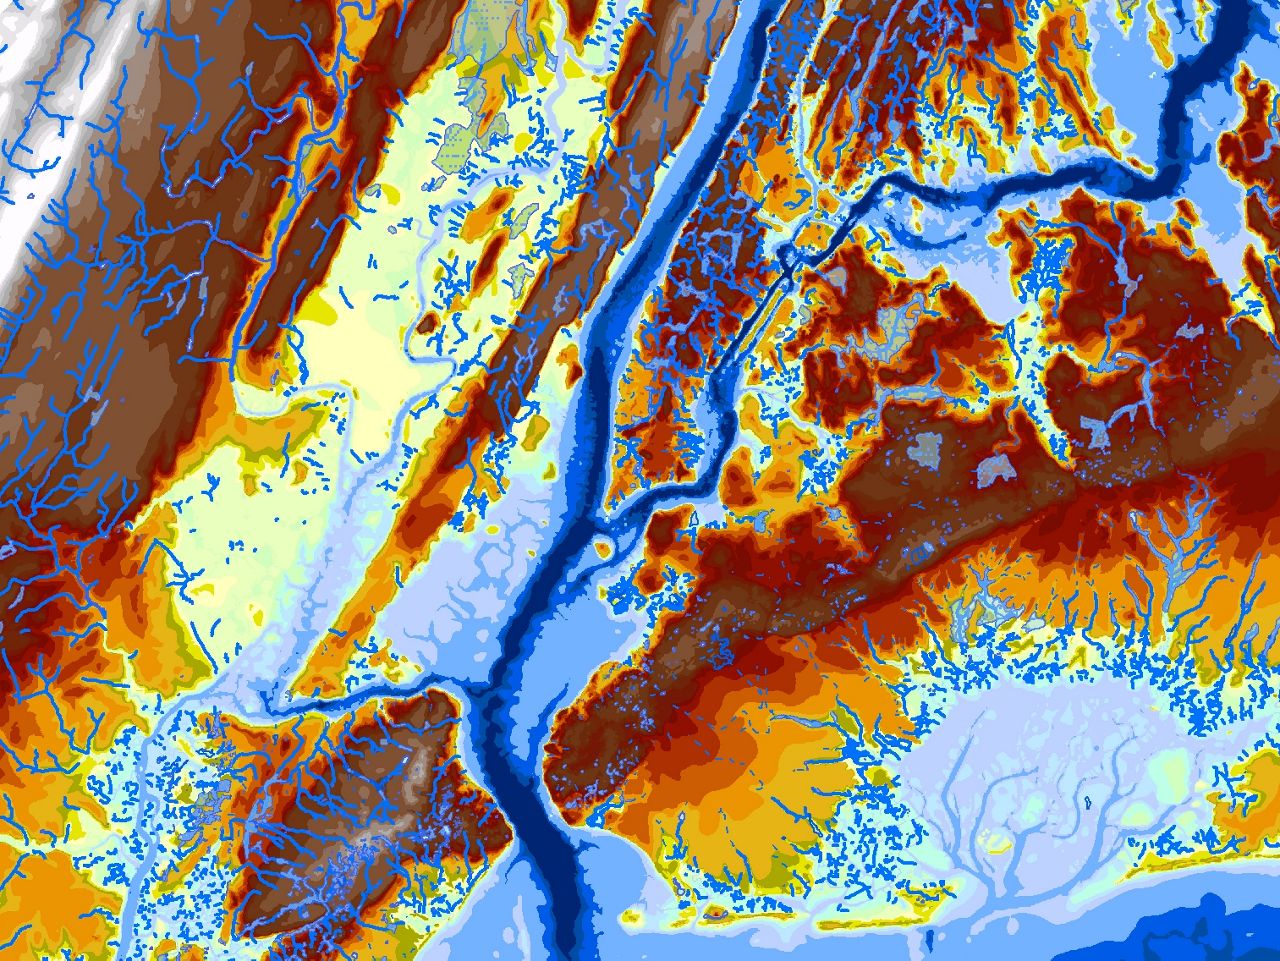
In the following days, Sanderson, an ecologist at the Wildlife Conservation Society, turned to the side project that has consumed his life for much of the past two decades: a digital map, meticulously constructed from hundreds of other maps, that imagines what the landscape that became the country’s largest metropolitan area looked like on the day it was first seen by Europeans.
He cross-referenced the locations of the 13 deaths caused by the storm with his immense chart of the city’s buried, drained, filled-in or paved-over waterways. In every case, he said, the result was the same.
People had built their lives in places that used to be underwater. And water, Sanderson likes to say, has memory.
“Maybe there was a wetland there, maybe there was a stream there, maybe there was a pond there, and people have forgotten,” Sanderson said in an interview. “But I have not forgotten.”
Sanderson is now being tapped by the city to bring his map, and the immense insights it contains into the city’s hydrological history, into its efforts to reimagine how we will live with more and more water.
Working with the city’s Department of Environmental Protection, he is identifying potential places for creating a hoped-for citywide network of bluebelts, urban wetlands that can hold orders of magnitude more rainwater than sidewalk gardens or sunken basketball courts that double as water tanks.
What started out as a thought exercise in environmental imagination has now become something of a blueprint. It shows the city where it should not have built, and could inform where the government targets buyout programs to move homeowners from vulnerable areas, said Rohit Aggarwala, the city’s chief climate officer and DEP commissioner.
In an interview, Aggarwala recalled a recent conversation of a kind he has a lot now: On a walking tour of a neighborhood he declined to name that sees consistent flooding, a resident noted that her mom used to go ice-skating where they were standing.
“‘So you live at the bottom of a drained lake. I think we know why it floods,’” Aggarwala recalled telling the resident. “I’m not saying we can’t help them, or we shouldn't help them, or be sympathetic. That’s an example of what Eric’s analysis can help us do, which may require us at some points to say, ‘I don't know how you could ever keep this particular place dry.’”
A map and a metaphor
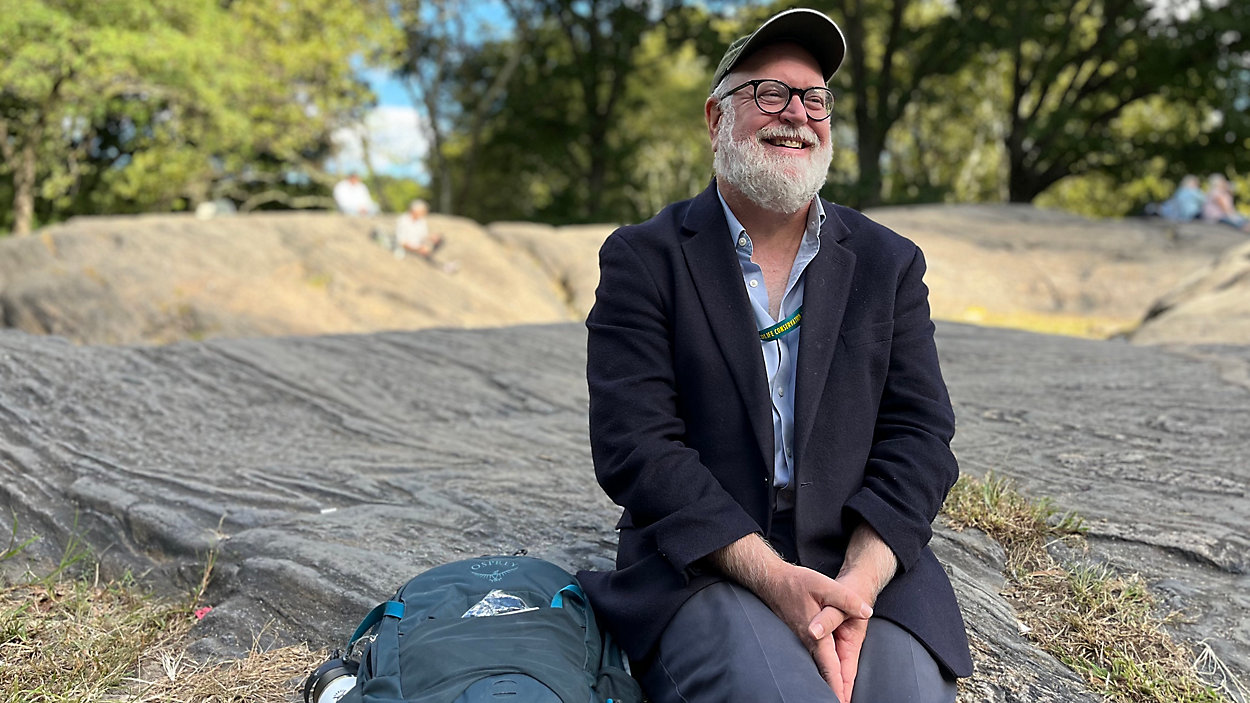
By day, Sanderson studies endangered animals from his office at the northern end of the Bronx Zoo. His desk is moderately cluttered; the bookshelves are packed with environmental studies titles and a curated collection of elephant figurines. He looks, with his full, pearly white beard and conservation nonprofit baseball cap, as though the folk musician Bill Staines had picked up birding binoculars instead of a guitar.
In conversation, Sanderson underscores his blunter statements with big laughs, and likes to drop the kinds of facts that make people who aren’t well versed in geologic time dissociate somewhat. The enormous rock outside his office building, he said, is more than a billion years old.
“There was a mountain range the size of the Himalayas here that the climate took away,” he said with a laugh during an interview in Central Park. “So it will win in the long run. It’s just about how much suffering we want to take in the meantime.”
He relishes this constant connection to the land’s long history; it’s why he made the first map. In the before times, his work sent him around the world to consult with biologists and conservationists for jaguars, elephants, tigers and the like. They had a sense of place that he did not yet have about New York City, where he moved after growing up in California.
One day, while shopping in The Strand bookstore, he found an old volume of even older maps of the city. If he could use georeferencing software to map those maps onto the current city, he thought, he could figure out what each part of the city used to look like before colonization.
That effort became The Mannahatta Project, which visualized Manhattan on the afternoon Henry Hudson sailed into the river that would gain his name, and which made predictions for the habit type, flora, fauna and likelihood of native settlement for every block.
The map fed a surge in ecologically minded art, architecture and city design, fueling activist efforts to bring nature back into the city, such as the push to daylight Tibbetts Brook in the Bronx. Sanderson became a volunteer advisor for Maya Lin as she made pin sculptures of the city’s covered rivers and streams.
“Most people look around at the city and think, ‘I need a parking space, I want to park my car there,’” said Kate Orff, the founding principal of SCAPE, a landscape architecture firm. “He’s like, ‘That used to be where a Virginia rail would get its fish.’ He has a very different set of eyeballs of what a city is.”
Orff, who helped design the resilience plan for the South Street Seaport area, said that she often uses the Mannahatta Project to frame her pitches to developers.
“It’s like a project about the past that became a metaphor of the future about what we could do,” Orff said. “But that metaphor only takes you so far. It’s like, by the way, there's a multifamily housing development in a former lake in Queens.”
Wet in 1870, flooded in 2022
With the sparking interest in his work, Sanderson had hoped to show the city an early discovery that predicted his findings after Ida: When he overlaid flooding from Hurricane Sandy with his early map, the waterlogged areas corresponded cleanly with the locations of old salt marshes and streams. But the interest wasn’t there.
He continued expanding his computer chart of the city. Working with research assistants, he scoured archives for hundreds of old maps of the five boroughs and parts of New Jersey and Connecticut, cross-referencing them with written accounts from diaries, travel journals and indigenous histories. They traced each map by hand, noting the contours of the shorelines and habitats, and manually adjusting them for changes in sea level and local topography.
The map became an intensely detailed computer program, feeding ideas for custom artist visualizations of different vantage points in the city: looking toward Manhattan from Yankee Stadium, seeing Brooklyn from 200 feet above the shoreline. He is working on a full atlas of this lost landscape, which he hopes to publish in 2024 — if he can manage to stop researching.
Eventually, Sanderson said, he hopes to marshal the kind of computing power that feeds video game graphics to allow someone to take a picture from anywhere in the city and generate a matching image of the same perspective from 400 years ago.
Then Ida hit. An op-ed he published made the rounds.
The city reached out.
“They asked,” Sanderson said. “And as a citizen and a scientist, I responded.”
The city relies on the map on an as-needed basis, consulting it alongside other, forward-looking maps it has developed that project risk of flooding from rainfall in the present and in future decades.
“We send Eric a note and say, ‘Hey Eric, can you take a look at such and such corner,” Aggarwala said. “Inevitably, he goes, ‘Oh yeah, in 1873 that was Joe’s Creek, or Jane’s Pond,’ or whatever. It explains it. The places that were dry in 1870 are not flooding in 2022. The places that were wet in 1870 are the places that are flooding in 2022.”
The results of the city’s ongoing research, Aggarwala said, have the potential to create new park spaces that reintegrate many neighborhoods with natural ecosystems for the first time in a hundred years or more.
“People are gonna see that bringing back nature into the city is gonna be tremendously valuable for all of us,” he said.
But the results may also be uncomfortable, and make people frustrated to learn that they were sold a home, or ushered into a new development, on land that was once not land, Aggarwala said — and that they may have to leave, down the road.
“If you make a map of where the streams used to be 400 years ago, you make a map of where people are complaining today, and you make a map of where projections are it'll flood in the future, and all three of those maps align, I think that's telling you something,” Sanderson said. “And I think it's kind of hard to argue with it.”