


New Yorkers can now see real-time data from flood sensors installed around the city that monitor street flooding during major rainstorms and coastal surges.
The dashboard for FloodNet, a project led by researchers at CUNY and New York University, shows data feeds for sensors installed in seven neighborhoods around the city, including clusters in the Gowanus and Red Hook neighborhoods of Brooklyn, Crotona Park in the Bronx and by the College of Staten Island.
The project aims to install 500 sensors across the city over the next five years. As new sensors are added, they will appear on the dashboard intersection by intersection.
“We are hoping that it’s of use to community members, so they can get a sense of the type of flooding that’s happening in their neighborhoods,” said Andrea Silverman, an assistant professor at NYU’s Tandon School of Engineering.
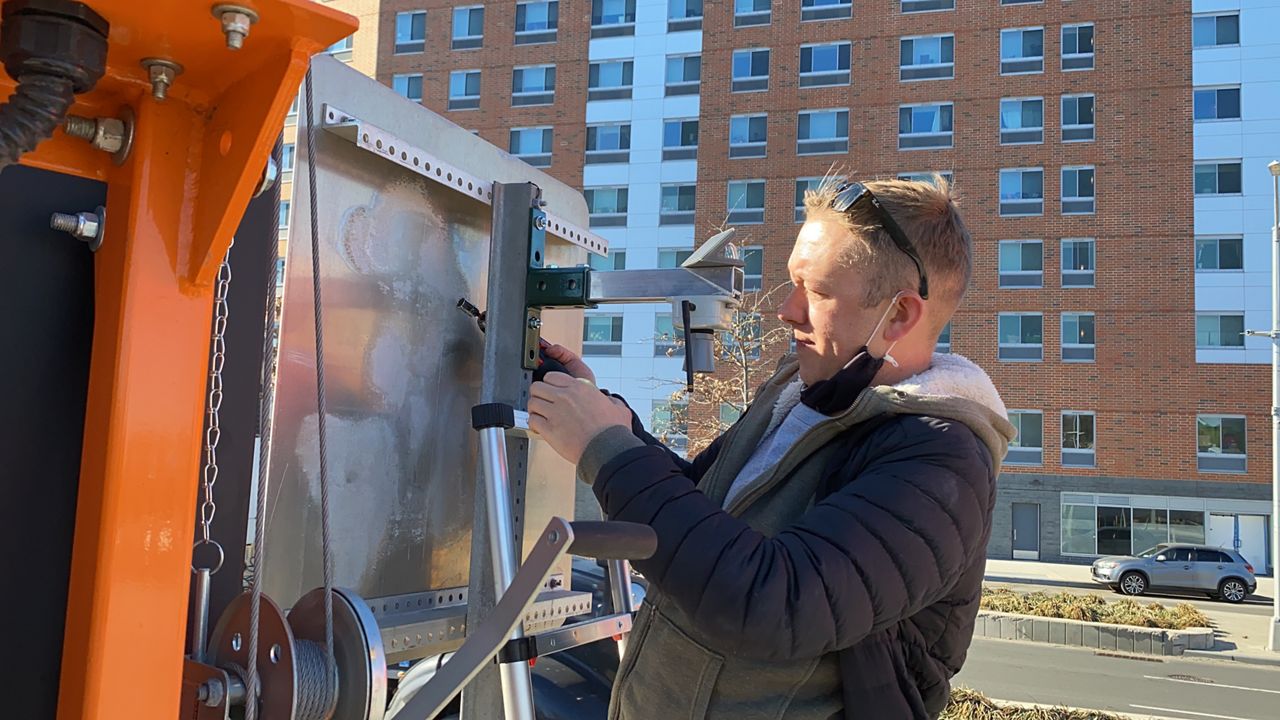
The sensor program began two years ago, when a city climate office partnered with academic researchers to find a way to collect data on both how much flooding neighborhoods get and where city infrastructure pushes floodwaters on streets and in sewers.
The dashboard allows viewers to see all of the data a sensor has recorded since its installation, and compare it to recorded precipitation and tide levels. Sensors installed in Gowanus in 2021 show that one intersection saw a maximum of three feet of flooding during Hurricane Ida.
With the National Oceanic and Atmospheric Administration still predicting an unusually active hurricane season, despite few storms in the Atlantic Ocean so far, residents who live near the active sensors will be able to monitor them for rising waters.
“If there is flooding, you'll see it,” Silverman said.
The researchers are asking residents to report high water in neighborhoods across the city, and suggest new intersections for installing the sensors to best monitor for local flooding.
“We don't know in a particular neighborhood which corner floods first,” Silverman said.